Scrape and Create Your Beautiful Dataset in 5 minutes (Python)
From sports-reference.com or any other website like a pro.
A lot of us like dabbling in our own little data science and machine learning — and if you’re into sports, you may find yourself wanting to acquire large data sets for certain sports. Although websites like Kaggle and data.world may give you the exact dataset you need — you will often want a way to handpick your own data and customize it according to your needs. Music to the ears of almost all data scientists.
A great website to find tons of data is sports-reference.com which I will use for this example. From sports like soccer to college football, you can find years and years worth of data here but the same concepts in this demo can be used across any public data source on the internet.
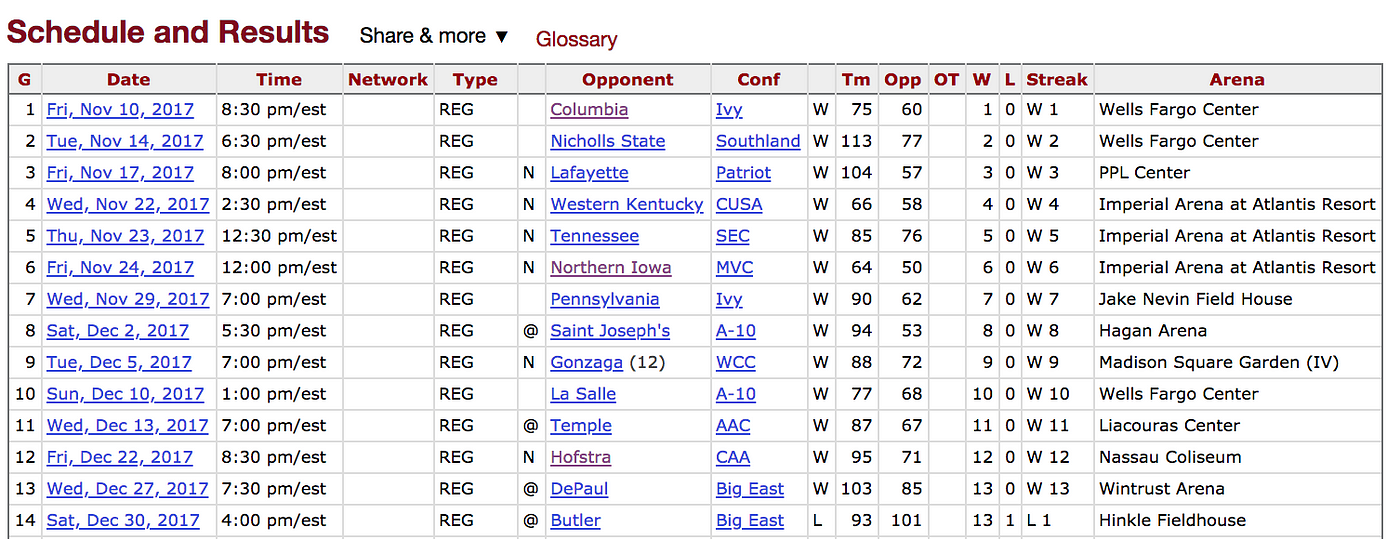
Alright. Let’s cut to the chase. We all want an easy and simple way to scrape data that looks something like this and say, put it in a pandas DataFrame.
In order to do this, we will We begin by importing the following libraries:
from urllib.request import urlopen
from bs4 import BeautifulSoup
import pandas as pd
Let’s talk about the first library — urlopen will allow us to give the library a url for which we would like to get our html data from. This is done with a the read() method as shown below:
url = “https://www.sports-reference.com/cbb/schools/villanova/2018-schedule.html”
page = urlopen(url).read()
The variable page now holds the HTML contents of the url in a string.
Now let’s talk about the second library, BeautifulSoup. We can use BeautifulSoup in order to find the data we actually need in our dataset. BeautifulSoup allows us to easily parse through the numerous tags that our HTML has in order to easily grab data that may follow a pattern. We will see how this works in just a few moments.
soup = BeautifulSoup(page)
 count = 0
 table = soup.find(“tbody”) // why did I do this? read below
Our data is embedded in the the tbody tag. How did I know this? Well a very important skill that everyone using BeautifulSoup needs to have is identifying patterns. Before I started programming my script, I did a quick print of what the website’s html looked like and got something that looked like this:
Code:
url = “https://www.sports-reference.com/cbb/seasons/2018-school-stats.html"
page = urlopen(url).read()
print(page)
Output (I like to copy and paste the output onto another editor tab so the html is easier to read). Only the bold tags are important in this example —
...
</thead>
  <tbody>
<tr ><th scope="row" class="right " data-stat="ranker" >1</th><td class="left " data-stat="school_name" ><a href='/cbb/schools/abilene-christian/2018.html'>Abilene Christian</a></td><td class="right " data-stat="g" >32</td><td class="right " data-stat="wins" >16</td><td class="right " data-stat="losses" >16</td><td class="right " data-stat="win_loss_pct" >.500</td><td class="right " data-stat="srs" >-9.14</td><td class="right " data-stat="sos" >-6.82</td><td class="right " data-stat="wins_conf" >8</td><td class="right " data-stat="losses_conf" >10</td><td class="right " data-stat="wins_home" >9</td><td class="right " data-stat="losses_home" >6</td><td class="right " data-stat="wins_visitor" >6</td><td class="right " data-stat="losses_visitor" >9</td><td class="right " data-stat="pts" >2359</td><td class="right " data-stat="opp_pts" >2279</td><td class="right " data-stat="x" ></td><td class="right " data-stat="mp" >1290</td><td class="right " data-stat="fg" >870</td><td class="right " data-stat="fga" >1874</td><td class="right " data-stat="fg_pct" >.464</td><td class="right " data-stat="fg3" >213</td><td class="right " data-stat="fg3a" >656</td><td class="right " data-stat="fg3_pct" >.325</td><td class="right " data-stat="ft" >406</td><td class="right " data-stat="fta" >579</td><td class="right " data-stat="ft_pct" >.701</td><td class="right " data-stat="orb" >305</td><td class="right " data-stat="trb" >1093</td><td class="right " data-stat="ast" >482</td><td class="right " data-stat="stl" >260</td><td class="right " data-stat="blk" >128</td><td class="right " data-stat="tov" >461</td><td class="right " data-stat="pf" >671</td></tr><tr ><th scope="row" class="right " data-stat="ranker" >2</th><td class="left " data-stat="school_name" ><a href='/cbb/schools/air-force/2018.html'>Air Force</a></td><td class="right " data-stat="g" >31</td><td class="right " data-stat="wins" >12</td><td class="right " data-stat="losses" >19</td><td class="right " data-stat="win_loss_pct" >.387</td><td class="right " data-stat="srs" >-4.31</td><td class="right " data-stat="sos" >1.72</td><td class="right " data-stat="wins_conf" >6</td><td class="right " data-stat="losses_conf" >12</td><td class="right " data-stat="wins_home" >9</td><td class="right " data-stat="losses_home" >7</td><td class="right " data-stat="wins_visitor" >3</td><td class="right " data-stat="losses_visitor" >10</td><td class="right " data-stat="pts" >2124</td><td class="right " data-stat="opp_pts" >2244</td><td class="right " data-stat="x" ></td><td class="right " data-stat="mp" >1245</td><td class="right " data-stat="fg" >733</td><td class="right " data-stat="fga" >1751</td><td class="right " data-stat="fg_pct" >.419</td><td class="right " data-stat="fg3" >250</td><td class="right " data-stat="fg3a" >755</td><td class="right " data-stat="fg3_pct" >.331</td><td class="right " data-stat="ft" >408</td><td class="right " data-stat="fta" >556</td><td class="right " data-stat="ft_pct" >.734</td><td class="right " data-stat="orb" >302</td><td class="right " data-stat="trb" >1014</td><td class="right " data-stat="ast" >445</td><td class="right " data-stat="stl" >201</td><td class="right " data-stat="blk" >78</td><td class="right " data-stat="tov" >391</td><td class="right " data-stat="pf" >557</td></tr>.
.
.    </tbody>...
With this html output, we notice two key facts:
- All of the actual data and the headers are within this tbody tag. This is good because we want to be able to essentially “zoom in” on the data and be able to categorize it in a way to where we don’t end up hardcoding the data we want.
- Each row has a tr (table row) tag and each category has it’s own data-stat classifier in a th (table heading) tag.
Now we can use our handy-dandy coding skills and the help of BeautifulSoup’s incredible library to get what we want in just a few more lines of code:
table = soup.find("tbody")
pre_df = dict()
features_wanted =  {'opp_name', 'pts', 'opp_pts',                      'game_location','game_result','overtimes','wins','losses', 'date_game'} #add more features here!!rows = table.find_all('tr')
for row in rows:
    if (row.find('th', {"scope":"row"}) != None):    for f in features_wanted:
        cell = row.find("td",{"data-stat": f})        a = cell.text.strip().encode()
        text=a.decode("utf-8")
        if f in pre_df:
             pre_df[f].append(text)
        else:
             pre_df[f]=[text]

        df = pd.DataFrame.from_dict(pre_df)
I make a set of features I want from this table and store it in features_wanted. Make sure these features are spelled exactly the same as the way they are spelled in the html data-stat classifiers. I create a dictionary called pre_df which will hold feature names as keys and lists of data as values.
Once I know the features I want, I use my table to call find_all() on the tr tags. I hold this in a variable called rows and it holds a list of all the rows, with each row being a separate entity. This is good because now we can loop through each row and grab the data we want and finally put it in our dataframe.
The first for loop loops through rows and makes sure it has a th tag. Inside this loop I loop through my set of features that I had hardcoded earlier and then grab the data from each row by using the find() function. After doing a few encoding modifications, I either: append the new data value in the dictionary’s list for that feature, or I create a new key in the dictionary with that new value as a list.
Finally, I convert this dictionary to a dataframe using the pandas library’s from_dict() function.
The code for my project was supposed to create a data_frame like this for all of the schools in the association so there is an extra get_schools() function in the original code seen here. I have bolded the code segments that were explained in the article above.
from bs4 import BeautifulSoup
from urllib.request import urlopen
import pandas as pddef getSchools():
    url = "https://www.sports-reference.com/cbb/seasons/2018-school-stats.html"
    page = urlopen(url).read()
    print(page)
    soup = BeautifulSoup(page)
    count  = 0
    table = soup.find("tbody")
    school_dict = dict()
    for row in table.findAll('td', {"data-stat": "school_name"}):
        school_name = row.getText()
        for a in row.find_all('a', href=True):
            link = a['href'].strip()
            name = link[13:].split("/")[0]
            school_dict[name] = school_name

    return school_dictdef getDfs():
    school_set = getSchools()
    dfs = []
    final_df=pd.DataFrame()
    for school in school_set:
        url = "https://www.sports-reference.com/cbb/schools/" + school + "/2018-schedule.html"
        page = urlopen(url).read()
        soup = BeautifulSoup(page)
        count = 0
        pre_df = dict()
        school_set = getSchools()
        table = soup.find("tbody")
        featuresWanted =  {'opp_name', 'pts', 'opp_pts',
                           'game_location','game_result','overtimes','wins','losses', 'date_game'} #add more features here!!        rows = table.find_all('tr')
        for row in rows:
            if (row.find('th', {"scope":"row"}) != None):            for f in featuresWanted:
                    cell = row.find("td",{"data-stat": f})                    a = cell.text.strip().encode()
                    text=a.decode("utf-8")
                    if f in pre_df:
                        pre_df[f].append(text)
                    else:
                        pre_df[f]=[text]

        df = pd.DataFrame.from_dict(pre_df)
        df["opp_name"]= df["opp_name"].apply(lambda row: (row.split("(")[0]).rstrip())
        df["school_name"]=school_set[school]
        df["school_name"] = df["school_name"].apply(removeNCAA)
        final_df=pd.concat([final_df,df])
    return final_df
def removeNCAA(x):
    if("NCAA" in x):
        return x[:-5]
    else:
        return x
def csvDump():
    df=getDfs()
    df.to_csv("scraped_data.csv")csvDump()
A final thing to note is that scraping this data for all the schools took around ~5 minutes, so a more time efficient strategy would be to store your dataframe in a csv file (as shown in the csvDump() method). This way your data is easily accessible and ready to go when you start your analysis!
Good Luck!
*Note: This code was written by me and two other students at CMU for our Practical Data Science final project.